When the Dashboard Lies: How Misleading Engineering Metrics Are Quietly Draining Project Margins
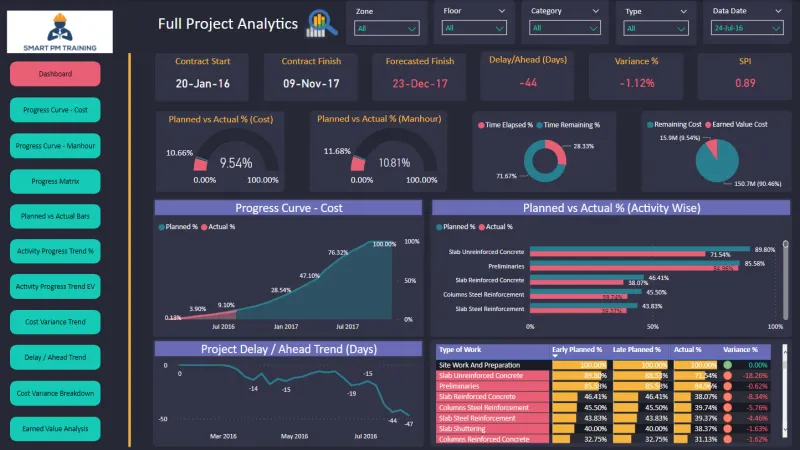
Photo: engineering project dashboard metrics office screen data analysis, via blog.smartpmtraining.com
There is a particular kind of organizational confidence that develops when every status report reads green. Milestones are met. Phase-gate budgets hold. Delivery percentages climb toward one hundred. Leadership receives the numbers, nods with satisfaction, and moves to the next agenda item.
Then the project closes—and the margin is gone.
This pattern is not rare in U.S. engineering firms. It is, in fact, disturbingly common. The explanation is straightforward, if uncomfortable: many of the metrics that engineering organizations track with the greatest diligence are measuring the wrong things entirely. They capture activity, not value. They reflect the past, not the trajectory. And in doing so, they allow the actual drivers of cost and profitability erosion to operate undetected until the damage is already done.
The Seductive Simplicity of Phase-Gate Metrics
Phase-gate reporting became standard in engineering project management for good reasons. Breaking a project into discrete stages—feasibility, design, procurement, construction, commissioning—and attaching budget and schedule benchmarks to each creates a structured accountability framework. It makes large, complex projects manageable. It gives leadership clear decision points.
The problem is that phase-gate metrics measure compliance with a plan, not alignment with a profitable outcome. A team can deliver every phase on time and on budget while quietly accumulating the conditions that will destroy final-stage margin. Scope that was never formally added gets absorbed informally. Rework cycles are completed within phase budgets by compressing other line items. Workarounds are implemented rather than root causes resolved.
By the time the financial reality surfaces—often at project close-out or during the first operational year—the phase-gate record looks clean. No single checkpoint failed. And yet the project underperformed.
Why On-Time Delivery Is Not the Metric You Think It Is
On-time delivery rates are among the most frequently cited KPIs in engineering project reviews, and among the least informative when examined in isolation. A deliverable submitted on schedule tells you that a deadline was met. It tells you nothing about whether the deliverable was correct the first time, whether it required informal revision cycles before formal submission, or whether the team made quality trade-offs to hit the date.
In firms where on-time delivery is tracked prominently and rework is tracked poorly—or not at all—the incentive structure becomes predictable. Teams submit on time. They revise informally. The official record shows a clean delivery rate. The actual cost of getting to an acceptable output is distributed invisibly across labor hours that never get attributed to the specific deliverable or the specific problem that caused the revision.
This is not a workforce integrity issue. It is a measurement design issue. When the metric does not capture the full cost of the outcome, the metric cannot be trusted to represent the health of the project.
The Leading Indicators Engineering Leaders Are Not Watching
The shift from lagging to leading indicators is a concept familiar in manufacturing and operations management, but it has been slow to take hold in engineering project oversight. Most project dashboards remain heavily weighted toward lagging indicators—budget spent, milestones completed, deliverables submitted. These tell you what has already happened. They are, at best, a rearview mirror.
Leading indicators, by contrast, signal what is about to happen. Several deserve far more attention than they currently receive in standard engineering project reporting.
Informal revision frequency. Tracking how often deliverables are revised before formal submission—even when those revisions do not trigger official change orders—reveals where design quality, scope clarity, or team alignment is breaking down. A rising informal revision rate is one of the earliest signals of a project in distress.
Scope query volume. When field teams, subcontractors, or downstream engineers are generating an above-average volume of questions about scope boundaries, it indicates that the project definition is not as complete as the design phase metrics suggested. Left unaddressed, this translates directly into cost.
Labor hour variance by discipline. Aggregate budget-to-actual comparisons obscure discipline-level signals. A project that is within overall budget may have one engineering discipline running significantly over hours while another runs under. That imbalance often reflects either an unrecognized scope problem or an emerging technical issue that is consuming disproportionate resources.
Change order lag time. The time between when a scope change is identified and when it is formally processed is a proxy for how well a project's change management infrastructure is functioning. Long lag times indicate that informal work is being performed before authorization—a pattern that reliably compresses margin.
Redesigning the Measurement Framework
Addressing the measurement trap is not simply a matter of adding more metrics to an existing dashboard. In many cases, the dashboard is already cluttered with numbers that receive attention without driving decisions. The goal is not volume of data. It is relevance.
Engineering project measurement frameworks should be built around a clear distinction between accountability metrics—those that confirm whether contractual and operational commitments are being met—and diagnostic metrics, those that reveal where the project is accumulating risk or cost that has not yet appeared in the financial record.
Accountability metrics have their place. Clients expect them. Contracts reference them. But they should not dominate internal project oversight. Internally, the diagnostic metrics are what allow project leadership to intervene before a problem compounds.
This requires a cultural shift as much as a technical one. Project managers who surface early warning signals—even when the official metrics look fine—need to be supported, not managed around. Organizations that have conditioned their teams to keep the dashboard green have, in many cases, also conditioned them to suppress the signals that would turn it yellow before it turns red.
The Cost of Waiting for the Numbers to Tell You
Financial reporting in engineering projects typically operates on a lag. By the time cost overruns appear in a formal project cost report, the conditions that caused them have often been present for weeks or months. The rework cycle has already run. The informal scope has already been absorbed. The labor has already been spent.
Firms that wait for the financial report to identify problems are managing the past. The engineering organizations that consistently protect margin are the ones that have built the measurement infrastructure to see trouble while there is still time to respond.
The dashboard that always reads green is not a sign of a well-run project. It is often a sign of a poorly designed measurement system. Recognizing that distinction is the first step toward building one that actually serves the business.